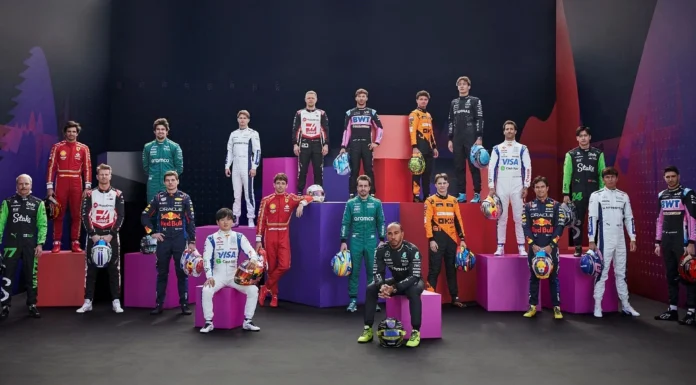
Most Followed Formula 1 Drivers on Social Media
The 2024 Formula 1 World Championship has already started at the beginning of this month with the Bahrain Grand Prix on March 2, and as fans of the sport, we wanted to take a look at who are the most followed Formula 1 drivers...
Who Has The Most Followers on TikTok in 2024 and What Do They Post
Ever since it was released in 2016, TikTok has taken the world by storm. Creators from all over the world have rushed in to show their creativity in the form of short 15-second to 3-minute videos. The platform now has over 1 billion monthly active...
2024 Social Media Marketing Tips From 20+ Marketing Experts
In the newest “We Are Social” report we find out that chat/messaging and social media apps are the ones accessed the most by Internet users aged between 16 and 64. As you can see in the image below, the third place is occupied by search...
5 Digital Marketing Lessons to Learn from the Tourism Industry
It’s February. You’re cold. And the tourism industry knows this. You’d think that this gives the digital marketers of tourism a head start, seeing as everyone wants to go on vacation all the time. But actually, to convert numerous people and direct them to...
AI Tools for Marketers in 2024 recommended by 20+ Marketing Experts
The integration and use of artificial intelligence (AI) tools have become a must in the digital marketing sector and are already a “game changer” for companies of all sizes. AI tools are no longer just a fad or a luxury but a necessity and...
Top 30 Most Visited Websites in the World
Have you ever wondered what are the most visited websites in the world?In this article, you'll find out not only which are the top 30 most visited websites, but also detailed information on each one, like:- the brand's original country,- the website category,- the...
Coolest Music YouTube Channels: From Fun to Educational
So far in our YouTube series, we’ve talked about the most-subscribed YouTube channels, funniest YouTube channels, and my favorite YouTube history channels, but now it’s time for one of my favorite things in the whole world: music. There are a ton of popular musicians...
2024 Digital Marketing Trends From 20+ Marketing Experts
The digital landscape has changed after the increasing adoption of different artificial intelligence tools like ChatGPT. Talking about ChatGPT, here are some interesting statistics about its incredible growth since they launched the service in November 2022:It reached 1 million users in just 5 daysIt now...
20 Most Popular TikTok Trends of 2024
What are some of the most popular TikTok trends? With so many people following and posting on TikTok, it’s no wonder that there are some challenges, video themes, special effects, and background songs that blow up on TikTok and become TikTok trends that everyone uses...
Top 25 Most Popular Social Media Sites You Need to Know
How many big social media platforms do you know?Let us guess - you immediately thought of Facebook, Instagram, Twitter, YouTube, and, perhaps, Pinterest. And you’re absolutely right, those are some of the biggest social media sites. But they’re definitely not the only major players out...
Best 13 Social Media Analytics Tools of 2024 (Paid & Free)
By now, most advertisers understand that social media marketing is no longer an option but a must-have integrated part of the digital marketing mix. Yet, digital marketers face a difficult task: justifying investment with results. And although social media advertising is the second biggest market...
14 Most Popular Instagram Trends That Will Impact 2024
At 2.4 billion monthly active users, Instagram is still one of the most active social media platforms, ahead of TikTok even, which has a little over 1 billion monthly active users. 23.1% of people over 13 from all over the world are using Instagram. With...
Best Social Media Management Tools Everyone Can Use in 2024 (Paid & Free)
Whether you’re a freelance social media professional, a small business, or an agency, you need a social media management tool to help you manage your social networks and make your life easier. But what is the best platform to manage social media? What are the...
Mastering the Art of Facebook Advertising: A Comprehensive Guide
Facebook is one of the most popular and powerful platforms for online advertising. With more than two billion monthly active users, Facebook offers a huge potential audience for your business. However, reaching and engaging your target customers on Facebook is not as easy as...
The 9 Best Language Learning Apps in 2024 (Tried & Tested)
Are you looking to learn a new language or get more in-depth with one you already know? This article will help you identify the best language-learning app for you. BabbelBest comprehensive curriculumDuolingoBest free language appPromovaBest for in-depth learningRosetta StoneBest immersive environmentMemriseBest for pronunciationLingvistBest for fast...
Four Secret TikTok Advertising Tools to Grow Your Business
Have you tapped into TikTok marketing yet or hired a TikTok advertising agency to help you grow your business? Smart move if you have. TikTok has exploded to over a billion monthly users, making it a digital hub brands can't afford to ignore.But standing...
Best Social Media Memes
Memes are one of the best parts of social media, so it’s only natural that there are now memes about social media itself.And boy are they funny!We’ve gathered a collection of social media memes and split them into categories so you can find exactly...
11 Years of Hot in Social Media
Every year on December 12 we celebrate another birthday of our social media marketing blog. Today is the 11th birthday since our website was launched and it has been an exciting year with plenty of events in the social media ecosystem.The hottest topic of...
- Advertisement -
MOST POPULAR
- Advertisement -


